

[2026.02.06] NBA Precision Analysis Report & Picks: Philadelphia 76ers vs LA Lakers
1. Overall situation analysis
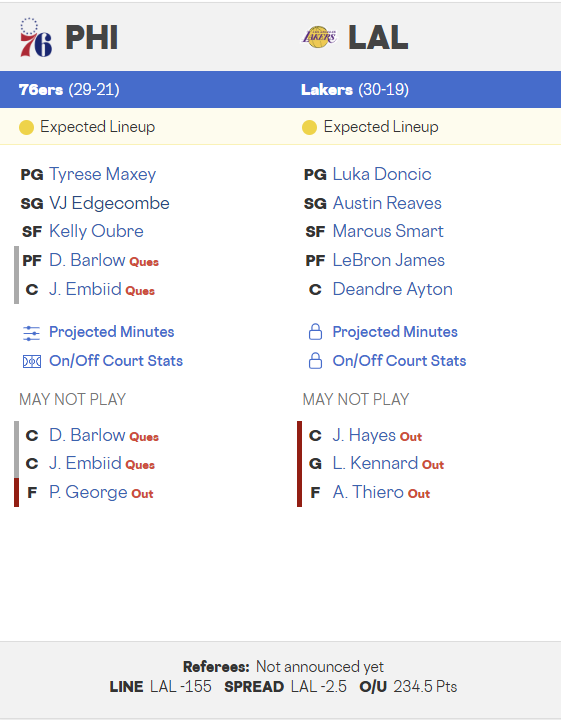
This is the second matchup of the season between the Philadelphia 76ers (5th in the East) and the LA Lakers (6th in the West). Philadelphia is currently at a seasonal peak, having secured 5 consecutive wins led by Tyrese Maxey. Crucially, Joel Embiid and Dominic Barlow are set to return for this game, significantly bolstering their interior presence. The LA Lakers feature elite playmakers Luka Doncic and LeBron James and lead the league in home field goal percentage. However, the Lakers have struggled with defensive consistency lately, with their defensive efficiency dropping significantly over the last 5 games.
2. Home/Away season indicators
| Metric | Philadelphia (Away Cumulative) | LA Lakers (Home Cumulative) | Comparative Analysis |
| Offensive Rating (OffRtg) | 113.6 (#12) | 118.5 (#6) | Lakers firepower edge |
| Defensive Rating (DefRtg) | 111.3 (#14) | 114.2 (#17) | Philadelphia defensive edge |
| Field Goal % (FG%) | 47.2% (#11) | 49.8% (#1) | Lakers precision edge |
| Defensive Efficiency (DEF EFF) | 0.512 (#14) | 0.534 (#18) | Philadelphia suppression edge |
| Turnovers (TOV/Gm) | 13.1 (#15) | 14.2 (#19) | Philadelphia stability edge |
| True Shooting % (TS%) | 58.8% (#8) | 60.6% (#2) | Lakers overall productivity edge |
| Pace | 99.0 (#12) | 98.6 (#20) | Lakers prefer half-court tempo |
3. Recent 5-game indicators
| Metric | Philadelphia (Value/Rank) | LA Lakers (Value/Rank) | Recent Trend Analysis |
| Offensive Rating (OffRtg) | 121.2 (#3) | 119.4 (#5) | Philadelphia peak firepower |
| Defensive Rating (DefRtg) | 108.5 (#5) | 117.8 (#24) | Philadelphia defensive surge |
| Field Goal % (FG%) | 51.2% (#2) | 50.3% (#4) | Philadelphia shooting edge |
| Defensive Efficiency (DEF EFF) | 0.492 (#5) | 0.542 (#24) | Lakers defensive struggle |
| Turnovers (TOV/Gm) | 12.5 (#10) | 14.2 (#18) | Philadelphia operational stability |
| True Shooting % (TS%) | 62.1% (#2) | 60.6% (#5) | Philadelphia productivity edge |
| Pace | 100.2 (#8) | 101.5 (#6) | Both teams accelerating transition |
4. Bench unit analysis
| Metric | Philadelphia Bench (Value/Rank) | LA Lakers Bench (Value/Rank) | Comparative Analysis |
| Offensive Rating (OffRtg) | 110.2 (#18) | 104.5 (#27) | Philadelphia bench firepower edge |
| Defensive Rating (DefRtg) | 109.8 (#10) | 116.5 (#26) | Philadelphia bench defensive edge |
| Field Goal % (FG%) | 44.5% (#22) | 42.1% (#28) | Philadelphia bench precision edge |
| Turnovers (TOV/Gm) | 3.1 (#4) | 5.2 (#28) | Philadelphia bench stability edge |
| True Shooting % (TS%) | 55.6% (#20) | 51.8% (#28) | Philadelphia bench productivity edge |
| Pace | 98.5 (#18) | 102.3 (#4) | Lakers bench mobility edge |
5. Paint zone indicators
| Category (Team Total) | Philadelphia (Value/Rank) | LA Lakers (Value/Rank) | Data-Based Analysis |
| Paint Points Scored (Gm) | 50.2 (#12) | 51.6 (#10) | Lakers interior attack edge |
| Paint Points Allowed (Gm) | 48.2 (#8) | 50.7 (#17) | Philadelphia rim protection edge |
| Rebound Margin (Gm) | +3.8 (#7) | -3.5 (#26) | Philadelphia dominant board control |
| Blocks (Gm) | 6.8 (#1) | 4.1 (#20) | Philadelphia elite height advantage |
6. Absence Off margin analysis
| Target Player (Team) | Status | On/Off Net Margin Impact | Tactical Impact Analysis |
| Paul George (PHI) | Out | Net Margin -6.5 decrease | Loss of wing defense and spacing |
| Jaxson Hayes (LAL) | Out | Net Margin -2.1 decrease | Reduction in bench big man depth |
| Luke Kennard (LAL) | Out | OffRtg Margin -1.8 decrease | Loss of bench perimeter spacing |
| Adu Thiero (LAL) | Out | Net Margin -1.5 decrease | Reduction in bench energy and mobility |
7. Detailed position-by-position matchup
Point Guard: Tyrese Maxey (Philadelphia) vs Luka Doncic (LA Lakers)
A battle between the physical playmaking of Doncic (33.4 PPG) and the lightning speed of Maxey (28.9 PPG). While Doncic holds the advantage in game control, Maxey’s recent shooting form (#2 in FG%) is capable of neutralizing the Lakers’ perimeter defense.
Shooting Guard/Forward: VJ Edgecombe (Philadelphia) vs Austin Reaves (LA Lakers)
The key is how much the rookie Edgecombe can suppress Reaves (26.1 PPG), who has been highly efficient since his return. Reaves’ recent True Shooting percentage (TS%) is among the league’s elite for bench-turned-starter players.
Power Forward: Dominic Barlow (Philadelphia) vs LeBron James (LA Lakers)
LeBron’s operational capability remains a significant threat. The returning Barlow’s defensive mobility and rebounding energy will be vital in contesting LeBron’s drives and securing the glass.
Center: Joel Embiid (Philadelphia) vs Deandre Ayton (LA Lakers)
The most critical matchup of the game. Embiid’s post-up game will likely force Ayton into foul trouble. If Ayton is forced to the bench, the Lakers’ interior will be vulnerable to Philadelphia’s size, including Drummond and Barlow.
8. deca check
- Momentum: Philadelphia Edge (5-game winning streak and return of Embiid/Barlow)
- Board Control: Philadelphia Absolute Edge (Rebound margin #7 vs #26)
- Operational Stability: LA Lakers Edge (Reflecting Luka Doncic’s elite playmaking)
- Perimeter Firepower: LA Lakers Edge (High 3PT productivity from Reaves/James)
- Absence Factor: Philadelphia Edge (1 key starter out vs 3 rotation players out for LAL)
- Bench Firepower: Philadelphia Edge (Drummond’s move to the bench bolsters second unit)
- Rim Protection: Philadelphia Absolute Edge (Expected to maintain league #1 block rank)
- Shooting Efficiency: LA Lakers Edge (Maintaining season #1 FG% ranking)
- Home/Away Advantage: LA Lakers Edge (Home shooting precision and energy)
- Ace Presence: Philadelphia Edge (Reflecting Embiid’s vertical dominance in the paint)
9. Final probability and expected score
| Category | Expected Result | Numerical Rationale |
| Final Win Probability | Philadelphia Win (52.8%) | Interior dominance with Embiid’s return |
| Handicap (+2.5) | Philadelphia Win (57.6%) | Lakers bench depletion and rebound disparity |
| Over/Under (234.5) | Under (54.2%) | Improved defense with Embiid and half-court focus |
Final Expected Score (10,000 Monte Carlo runs): Philadelphia 117 – 114 LA Lakers
10. Deep Analysis
The primary rationale for a Philadelphia 76ers victory lies in the qualitative improvement of their paint zone following the returns of Joel Embiid and Dominic Barlow. On offense, Embiid draws defensive gravity to the rim, creating open shooting lanes for Tyrese Maxey and Kelly Oubre. On defense, he acts as a massive wall, suppressing the drives of the Lakers’ primary scorers, Doncic and James. The addition of Barlow’s mobility to the forward rotation provides an energy level advantage over the Lakers’ veteran wings.
The LA Lakers boast the league’s #1 field goal percentage, but their defensive efficiency (#24 in the last 5 games) indicates a significant drop in suppression capability. Specifically, if Deandre Ayton falls into foul trouble against Embiid, the Lakers lack a viable alternative to protect the rim due to Jaxson Hayes’ absence. This will likely lead to excessive second-chance points and a rebounding deficit, which are expected to be the deciding factors.
Ultimately, the disparity in bench depth will dictate the outcome. With Austin Reaves moving to the starting lineup and Kennard/Hayes out, the Lakers’ bench cannot effectively contain Philadelphia’s Andre Drummond. Drummond’s presence during non-Embiid minutes is sufficient to turn the bench margin in Philadelphia’s favor. Therefore, Philadelphia is projected to overcome the road disadvantage and secure a narrow victory through their superior interior presence.
11. Deep Reasoning Insight
The core strategic shift in this game is the defensive gravity introduced by Embiid’s return. The Doncic-led Lakers offense will be forced to take more difficult shots against a set Philadelphia half-court defense. The resistance around the rim from Embiid and Barlow will be formidable. Furthermore, the Lakers’ lack of bench depth is likely to cause starter fatigue in the 4th quarter, which statistically favors Philadelphia for a comeback or a handicap cover.
12. Terminology
Offensive Rating (OffRtg): Estimated points produced per 100 possessions.
Defensive Rating (DefRtg): Estimated points allowed per 100 possessions.
Field Goal % (FG%): Ratio of successful shots to total attempts.
Defensive Efficiency (DEF EFF): Team defense metric for suppressing scoring production.
True Shooting % (TS%): Accurate scoring efficiency reflecting free throws and 3-pointers.
Pace: Average number of possessions and game speed per 48 minutes.