

[2026.02.06] NBA Precision Analysis Report & Picks: San Antonio Spurs vs. Dallas Mavericks
1. Overall situation analysis
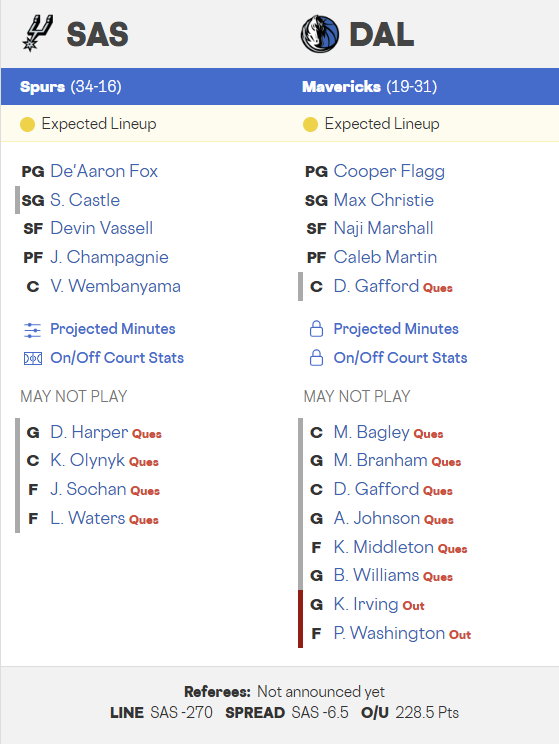
A high-stakes clash between the 2nd-place San Antonio Spurs and the 12th-place Dallas Mavericks, who are currently spiraling on a 5-game losing streak. Dallas is facing a systemic crisis following the trade of Anthony Davis and the injury absence of Kyrie Irving. Conversely, San Antonio, led by Victor Wembanyama and De’Aaron Fox, displays an elite balance between their starters and bench, making them well-prepared to exploit Dallas’s depleted rotation.
2. Home/Away season indicators
| Metric | San Antonio Spurs (Away Cumulative) | Dallas Mavericks (Home Cumulative) | Data-Based Comparative Analysis |
| Offensive Rating (OffRtg) | 113.4 (#15) | 115.9 (#13) | Dallas home firepower remains a threat |
| Defensive Rating (DefRtg) | 108.8 (#3) | 113.5 (#11) | SAS road defense is league top-tier |
| Field Goal % (FG%) | 47.3% (#8) | 47.0% (#15) | SAS holds slight edge in precision |
| Defensive Efficiency (DEF EFF) | 0.510 (#4) | 0.552 (#25) | SAS superior in suppression |
| Turnovers (TOV/Gm) | 13.1 (#5) | 15.1 (#27) | SAS superior in operational stability |
| True Shooting % (TS%) | 58.5% (#10) | 55.4% (#26) | SAS superior in overall productivity |
| Pace | 103.3 (#3) | 101.5 (#6) | Both teams prefer a fast tempo |
3. Recent 5-game indicators
| Metric (League Rank) | San Antonio (Value/Rank) | Dallas (Value/Rank) | Recent Trend Analysis |
| Offensive Rating (OffRtg) | 117.4 (#5) | 109.5 (#25) | Dallas offensive stagnation due to absences |
| Defensive Rating (DefRtg) | 106.5 (#2) | 116.4 (#22) | SAS defensive peak |
| Field Goal % (FG%) | 48.8% (#4) | 43.9% (#29) | SAS dominant in finishing |
| Defensive Efficiency (DEF EFF) | 0.492 (#2) | 0.565 (#22) | Dallas interior suppression collapse |
| Turnovers (TOV/Gm) | 13.5 (#10) | 11.6 (#12) | Dallas stable but lacks scoring output |
| True Shooting % (TS%) | 59.8% (#5) | 52.2% (#30) | SAS overwhelming productivity |
| Pace | 102.3 (#3) | 99.2 (#20) | SAS maximizing transition |
4. Bench unit analysis
| Metric (Cumulative) | San Antonio Bench | Dallas Bench | Comparative Analysis |
| PPG | 40.6 (#8) | 41.3 (#6) | Both benches provide high output |
| Offensive Rating (OffRtg) | 112.5 (#11) | 111.0 (#18) | SAS slight edge in productivity |
| Defensive Rating (DefRtg) | 108.4 (#4) | 114.2 (#22) | SAS bench defense is robust |
| Field Goal % (FG%) | 48.9% (#3) | 44.3% (#20) | SAS bench superior in finishing |
| Turnovers (TOV/Gm) | 3.1 (#4) | 5.9 (#29) | SAS bench dominant in stability |
5. Paint zone indicators
| Category (Team Total) | San Antonio Spurs (SAS) | Dallas Mavericks (DAL) | Data-Driven Analysis |
| Paint Points Allowed | 45.2 (#2) | 54.8 (#27) | Wembanyama’s rim protection dominance |
| Rebound Margin (Gm) | +4.8 (#4) | -3.5 (#26) | SAS dominant in board control |
| Blocks (Gm) | 6.8 (#1) | 4.1 (#22) | SAS height advantage is absolute |
| Paint Points Scored | 52.4 (#4) | 44.5 (#25) | SAS superior interior attack |
6. Absence Off margin analysis
| Player (Team) | Status | On/Off NetRtg Margin | Tactical Impact Analysis |
| Anthony Davis (DAL) | Out (Traded) | DefRtg Margin -10.5 | Interior defense and rebound system collapse |
| Kyrie Irving (DAL) | Out | OffRtg Margin -8.2 | Loss of playmaking and handling assets |
| Dereck Lively II (DAL) | Out | DefRtg Margin -4.8 | Height gap in center rotation |
| Jeremy Sochan (SAS) | Out | DefRtg Margin -2.8 | Slight decrease in wing defense energy |
7. Detailed position-by-position matchup
- PG: De’Aaron Fox (SAS) vs Ryan Nembhard (DAL)Fox’s elite speed and playmaking will likely overwhelm the rookie Nembhard. Fox has been in peak form, averaging 25.4 PPG over the last 5 games.
- SG: Stephon Castle (SAS) vs Max Christie (DAL)Castle has shown exceptional stability in secondary playmaking lately, leading SAS’s smooth ball flow. Christie may struggle to match his mobility.
- SF: Devin Vassell (SAS) vs Cooper Flagg (DAL)SAS will likely utilize Vassell and Wembanyama in a help-defense scheme to neutralize Dallas’s lone hope, Cooper Flagg. High probability of Flagg being isolated.
- PF: Julian Champagnie (SAS) vs Caleb Martin (DAL)Champagnie’s energy and perimeter spacing should provide a significant advantage over Martin in creating scoring opportunities.
- C: Victor Wembanyama (SAS) vs Daniel Gafford (DAL)Wembanyama (2.7 BPG) is expected to dominate Gafford in both height and skill, completely controlling the paint. Gafford is at high risk of foul trouble.
8. deca check
- Momentum: SAS Advantage (Dallas on a 5-game losing streak).
- Board Correlation: SAS Absolute Edge (Rebound margin ranked 4th).
- Operational Stability: SAS Advantage (Improved turnover control since Fox’s arrival).
- Perimeter Firepower: SAS Advantage (Multiple shooter options including bench).
- Absence Factor: SAS Absolute Advantage (Dallas missing 3 key starters).
- Bench Productivity: SAS Advantage (Maintaining top-4 bench defensive efficiency).
- Paint Defense: SAS Absolute Edge (Wembanyama’s interior suppression is league-best).
- Transition Speed: SAS Advantage (Pace ranked 3rd in the league).
- Home Court: Dallas (But recent home performance is league-bottom).
- Ace Presence: SAS Advantage (Wembanyama’s all-around destructive impact).
9. Final probability and expected score
| Analysis Category | Expected Result | Numerical Rationale |
| Final Win Probability | San Antonio Win (74.2%) | Reflects market avg for -6.5 line and roster collapse |
| Handicap (-6.5) | San Antonio Win (58.4%) | High probability of garbage time due to DAL handling gap |
| Over-Under (224.5) | Under (61.2%) | Reflects DAL offensive stagnation and SAS defensive peak |
Expected Score (10,000 Monte Carlo runs): San Antonio 114 – 106 Dallas
10. Deep Analysis
The San Antonio Spurs have successfully combined Victor Wembanyama’s defensive gravity with De’Aaron Fox’s high-tempo transition game. A critical differentiator is San Antonio’s bench production, which has maintained elite offensive efficiency during the last 5 games. This depth allows SAS to maintain high intensity for the full 48 minutes. Facing a Dallas team that has effectively lost its interior protection, San Antonio is highly likely to secure an early lead by bombarding the paint.
Dallas is currently leaning heavily on the talent of Cooper Flagg, but their current roster lacks the necessary support following the departures/absences of Irving and Davis. Their Offensive Rating has dropped to 25th recently, proving a lack of consistent scoring options. Even if Flagg scores over 25 points individually, it is unlikely to offset the productivity gap across other positions or the disparity in energy levels.
Finally, the gap in playmaking will decide the outcome. De’Aaron Fox has maximized his role by minimizing turnovers while creating high-quality looks for teammates. In contrast, without a main handler, Dallas is likely to resort to forced perimeter attempts to avoid Wembanyama’s height. San Antonio will capitalize on these misses with immediate transition points, which should lead to a comfortable victory covering the 6.5-point handicap.
11. Deep Reasoning Insight
The crux of this game lies in the isolation of Cooper Flagg and Dallas’s loss of playmaking structure. San Antonio is expected to employ a defense that cuts off secondary opportunities, forcing Dallas into inefficient 1v1 situations. San Antonio is projected to dominate in total assists and rebounds, and it will be extremely difficult for Dallas to reach the 110-point mark against such a disciplined defensive wall.
12. Terminology
OffRtg (Offensive Rating): Estimated points produced per 100 possessions.
DefRtg (Defensive Rating): Estimated points allowed per 100 possessions.
TS% (True Shooting Percentage): Real shooting efficiency reflecting FG, 3PT, and FT.
DEF EFF (Defensive Efficiency): Metric measuring the ability to suppress opponent shooting.
Pace: Average number of possessions per game.
Betting decisions are the responsibility of the individual. This report is for informational purposes based on precision data.