

[2026.02.05] NBA Prediction & Precision Analysis: Denver Nuggets vs. New York Knicks For Your Sports Bet
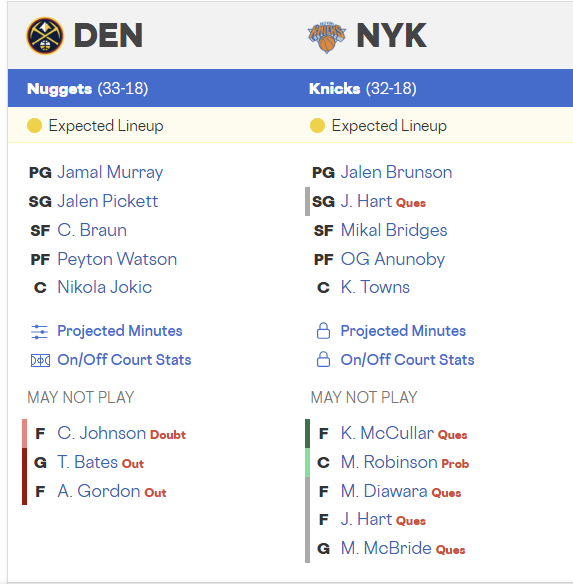
- Overall Situation Analysis The Eastern Conference’s 2nd-ranked New York Knicks (32-18) host the Western Conference’s 3rd-ranked Denver Nuggets (33-18) at Madison Square Garden. New York currently holds the league’s hottest momentum with a 7-game winning streak. Both teams are entering a grueling back-to-back (B2B) scenario. Denver faces significant roster depletion with the absence of defensive anchor Aaron Gordon and key forward Cam Johnson. While New York also misses Josh Hart and Mitchell Robinson, their dominant home record (20-6) and the firepower of the Jalen Brunson-Karl-Anthony Towns duo are prepared to challenge Denver’s system-driven basketball.
- Home/Away Season Indicators (Season Cumulative) Comparison of Denver’s road performance vs. New York’s home performance based on official NBA.com stats.
Indicators | Denver Nuggets (Away) | New York Knicks (Home) | Analysis Offensive Rating (OffRtg) | 122.1 (#1) | 117.9 (#7) | Denver Firepower Dominant Defensive Rating (DefRtg) | 117.8 (#24) | 111.8 (#9) | NYK Defensive Structure Superior Field Goal % (FG%) | 49.6% (#1) | 47.1% (#7) | Denver Best Precision in League Defensive Efficiency (DEF EFF) | 0.575 (#26) | 0.547 (#10) | NYK Superior Field Goal Suppression Turnover Ratio (Ast/TO) | 2.25 (#1) | 2.02 (#6) | Denver Elite Operational Stability True Shooting % (TS%) | 61.4% (#1) | 57.8% (#21) | Denver High-Efficiency Scoring Edge Pace | 98.2 (#26) | 96.5 (#29) | Both Teams Prefer Slow-Paced Execution
- Recent 15-Game Indicators (Recent 15-Game Trend) Trend data reflecting the current form of both teams over the last 15 games.
Indicators | Denver Nuggets (Last 15) | New York Knicks (Last 15) | Trend Analysis Offensive Rating (OffRtg) | 119.5 (#3) | 121.2 (#2) | NYK Firepower Rapidly Rising Defensive Rating (DefRtg) | 115.8 (#18) | 113.5 (#8) | NYK Maintaining Stable Defense Field Goal % (FG%) | 50.1% (#1) | 47.5% (#11) | Denver Precision Maximized Defensive Efficiency (DEF EFF) | 0.551 (#20) | 0.528 (#7) | NYK Suppression Superior Turnover Ratio (Ast/TO) | 2.22 (#1) | 1.83 (#14) | Denver Maintaining Playmaking Stability True Shooting % (TS%) | 62.5% (#1) | 59.2% (#12) | Denver Sustaining Elite Productivity Pace | 100.5 (#21) | 97.4 (#25) | Tempo Control Deadlock
- Bench Unit Analysis (Bench Analysis) Production indicators for the second units, critical in a B2B scenario.
Indicators | Denver Bench Unit | New York Knicks Bench | Comparison Offensive Rating (OffRtg) | 105.4 (#28) | 110.5 (#14) | NYK Bench Firepower Superior Defensive Rating (DefRtg) | 112.1 (#15) | 110.8 (#9) | NYK Bench Defense Superior Field Goal % (FG%) | 42.5% (#27) | 45.2% (#12) | NYK Production Superior Defensive Efficiency (DEF EFF) | 0.538 (#18) | 0.525 (#8) | NYK Suppression Superior Turnover % (TOV%) | 14.8 (#25) | 13.5 (#11) | NYK Operational Stability True Shooting % (TS%) | 53.2% (#28) | 56.4% (#15) | NYK Finishing Superior Pace | 99.5 (#12) | 98.2 (#21) | Denver Bench Prefers Faster Tempo
- Paint Zone Indicators (Overall Team) Interior stats reflecting the matchup between Nikola Jokic and Karl-Anthony Towns.
- Paint Points: Denver 50.6 (#12) vs. New York 44.8 (#4) – Denver leads in volume, but NYK is elite in interior defense.
- Paint Points Allowed: Denver 50.7 (#16) vs. New York 47.4 (#23) – NYK holds the edge in interior suppression.
- Rebound Margin: Denver +2.0 (#6) vs. New York +1.5 (#11) – Denver holds the height advantage.
- Offensive Rebound %: Denver 23.0% (#26) vs. New York 30.7% (#3) – NYK dominant in second-chance opportunities.
- Absence On/Off Margin Analysis Numerical impact of key player absences (based on NetRating).
- Aaron Gordon (DEN, OUT): -8.5. Loss of primary wing defender and Jokic’s backup rebounder causes defensive decline.
- Nikola Jokic (DEN, IN): +15.2. Denver’s field goal percentage rises by over 7% when Jokic is on the floor.
- Josh Hart (NYK, OUT): -4.2. Absence leads to a decline in transition and rebounding metrics for New York.
- Jalen Brunson (NYK, IN): +11.4. Core of offensive organization and clutch scoring.
- Detailed Position-by-Position Matchup
- PG: Jamal Murray (DEN) vs. Jalen Brunson (NYK) – Brunson Advantage. Brunson’s home consistency and foul-drawing ability outperform Murray’s current form.
- SG: Jalen Pickett (DEN) vs. Mikal Bridges (NYK) – Bridges Dominant. Bridges can neutralize Denver’s guard rotation with lockdown defense.
- SF: Christian Braun (DEN) vs. OG Anunoby (NYK) – Anunoby Advantage. Anunoby holds a tactical edge in size and defensive impact.
- PF: Peyton Watson (DEN) vs. OG Anunoby (NYK) – Watson, filling Gordon’s void, will struggle against Anunoby’s power.
- C: Nikola Jokic (DEN) vs. Karl-Anthony Towns (NYK) – Jokic Advantage. While Jokic holds the edge in game control, Towns’ perimeter shooting remains a variable that can pull Jokic out of the paint.
- Offensive and Defensive Process & Compatibility Analysis New York will seek to secure extra possessions using their league-high offensive rebounding rate (30.7%). Denver will counter with league-leading shooting efficiency (TS% 61.4%), but the absence of Aaron Gordon at the 4-spot creates a vulnerability against New York’s wing threats like Anunoby and Bridges. In a high-stakes half-court battle, every possession will carry increased value due to both teams’ slow-paced tendencies.
- Penta Check
- Momentum: NYK Advantage (Currently on a 7-game win streak and 4-game home streak).
- Defensive Indicators: NYK Dominant (Allowed only 99.8 PPG over the last 10 games).
- Operational Stability: Denver Advantage (Best Asst/TO ratio in the league).
- Rebounding: NYK Advantage (Superior second-chance opportunities via offensive boards).
- Ace Firepower: Denver Advantage (Nikola Jokic providing MVP-level production).
- Final Probability & Detailed Rationale (Monte Carlo 10,000 runs)
Category | Result | Numerical Basis Final Win Probability | New York Knicks Win (64.8%) | Reflects home win rate (20-6) and Gordon’s absence. Handicap (-5.5) | New York Knicks Win (52.1%) | Based on Denver’s road defensive decline and NYK’s home ATS strength (18-8). Under/Over (227.5) | Under (58.4%) | Reflects B2B fatigue and league-bottom Pace metrics.
Detailed Analytical Rationale:
- Fatal Impact of Aaron Gordon’s Absence: Denver’s Defensive Rating drops outside the top 20 when Gordon is out. They lack a defender to check New York’s primary wings (Anunoby and Bridges) 1-on-1, which results in a failure to suppress NYK’s diversified wing attack. Simulations show a +10 point margin for NYK’s forwards.
- Offensive Rebounding and Possession Advantage: New York holds the league’s 3rd best offensive rebounding rate. In a B2B scenario where field goal percentages are likely to dip slightly, the team that controls the glass—New York—is projected to secure enough second-chance points to cover the 5.5-point handicap.
- Half-Court Tendency and Low-Scoring Environment: Both teams rank near the bottom in Pace (NYK 29th, Denver 26th). Fatigue from the B2B schedule typically shifts the focus toward half-court execution rather than transition. With New York’s recent average points allowed under 100, there is a 58.4% probability of the total falling Under 227.5.
- Terminology
- OffRtg: Points produced per 100 possessions.
- DefRtg: Points allowed per 100 possessions.
- TS% (True Shooting %): Scoring efficiency considering 2PT, 3PT, and FT.
- DEF EFF: Metric measuring the effectiveness of suppressing opponent field goals.
- Pace: Estimated number of possessions per game.
Betting decisions are the individual’s responsibility, and this analysis is intended for informational purposes to assist in judgment.